NIFTY50 Index: Structural Overvaluation and Macro Risks Ahead
Tradzo initiates Sell on Nifty50 at 24,500 — Base Case Target 19,000 · Bear Case 17,000 · Worst Case 15,000 · Time Horizon: 6–12 months
SEBI Registered Research Analyst (INH000024675)
This research report is for informational purposes only and does not constitute investment advice. Investment in securities market are subject to market risks. Past performance is not indicative of future results. Please read all related documents carefully before investing. Tradzo Research is committed to SEBI compliance and transparent market analysis.
Sell Initiated At
24,500
04 March 2026
Recorded Low
22,955
Lowest level since initiation
Current Level
23,850
Corrective bounce — 18 Mar
Base Case Target
19,000
~22% downside from initiation
Trailing PE
22.30x
vs 16–18x fair value
MCap / GDP
133.6%
56% above median
Index PEG
2.12
Bubble territory > 2.0
Sell view initiated on March 4 at 24,500. Nifty made a low of 22,955 before a corrective bounce driven by short-term oversold conditions. The index has recovered to 23,850 on Tuesday, followed by a -900 point fall to 22900 on 19th March.
This confirms resumption of the downtrend. Immediate support zone is seen at 22,250–21,750, with 21,750 being the critical level — a breach below same level opens the path to 19,000.
West Asia risk escalation: If the conflict extends meaningfully beyond March and Hormuz remains disrupted through Q1–Q2 FY27, the Bear Case of 17,000 and Worst Case of 15,000 move from tail scenarios to elevated probability. The macro transmission — oil to CAD to earnings cuts — creates dual compression, not just a price correction.
Base Case
19,000
16.5× PE on ₹1,150 EPS · 38.2% Fibonacci
Bear Case
17,000
15× PE · 50% Fibonacci
War extends beyond March → elevated probability
Worst Case
15,000
13× PE · 61.8% Fibonacci
Hormuz closure + MF redemption cascade
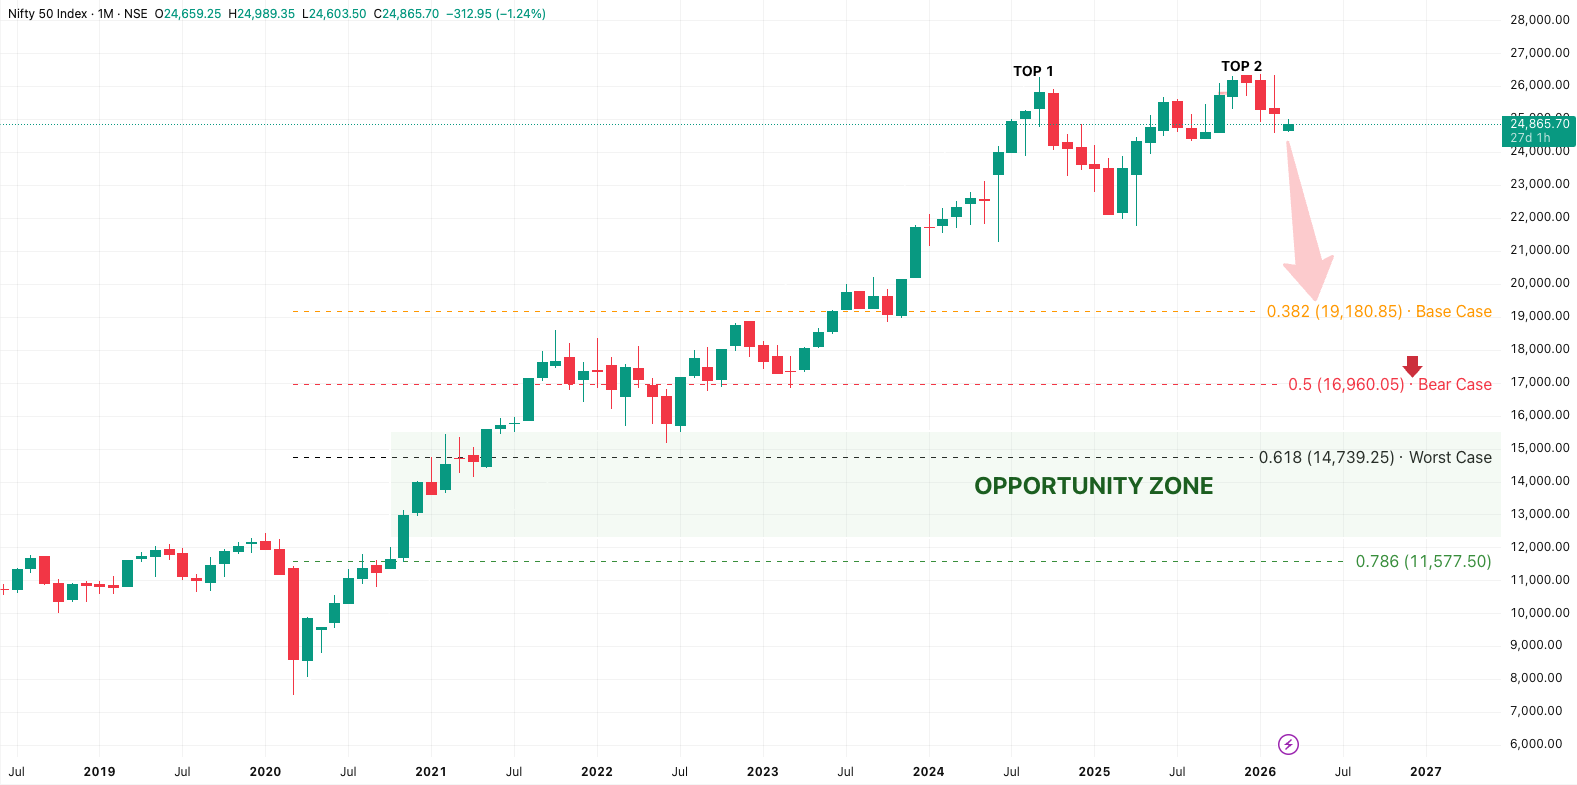
Figure 1 · NIFTY50 Technical Chart — Double Top Formation (March 2026)
Executive Summary
The Nifty50 RSI hit 100 on the yearly chart in 2025 — a reading so extreme it has appeared only twice before in this index's history, in 2007 and 2019, both preceding corrections of 38–60%. A trailing PE above 22 represents structural overvaluation following a 251% rally from the COVID low of 7,511 that has vastly outpaced underlying economic growth. What filled the gap between index returns of 21% CAGR and earnings growth of 8% CAGR is multiple expansion — and that process is now reversing.
The distribution phase is textbook. Each successive high in the final stages of a bull run comes with a marginally higher price but visibly weaker momentum and breadth. For Nifty, the open high of 26,341 on February 12 following the India-US trade deal announcement was the first lower high. The breach of Budget Day support at 24,571 on March 4 confirmed the lower low. The Double Top Formation has target of 22,800 — that level has almost reached, with Nifty making a low of 22,930, meanwhile support levels are seen at 22,250–21,750 as 3 consolidation support and low of 2025.
The macro backdrop has deteriorated faster than base assumptions. The West Asia conflict has moved from a prospective risk to a live economic shock — India's crude basket has reached $142.69 per barrel against Brent avg at $103, a $39 spread reflecting freight, war-risk insurance, and intermediary costs that futures screens do not show. We believe the bottom may form between 17,000-15,000 betweeen bearish to worst case scenario as the war likley to extend beyond March and Hormuz remains disrupted through Q1–Q2 FY27, creating a dual shock of earnings cuts and multiple compression.
- Trailing PE 22.30× vs historical fair value of 16–18× (24–39% overvaluation)
- Index rallied 251% from COVID low vs 42% real GDP growth over the same period
- EPS growth of 8% CAGR lags nominal GDP at 11% by 300 bps annually — eight years running
- Market Cap to GDP at 133.6% — near 20-year highs, 56% above historical median of 85.7%
- Weighted PEG of 2.12 — bubble territory begins above 2.0
- MF SIP inflows ₹3.34 lakh crore in 2025; total AUM ₹80 lakh crore — retail-heavy market at peak allocation
- Household equity allocation surged from 2% to 15% of savings — late-cycle participation spike
- Small and mid-cap liquidity stress exceeding 100 days — early warning of redemption risk
- Pro-cyclical liquidity: abundant during rallies, evaporates during corrections
Section 1: Technical Analysis — Distribution Phase and Bull Run Exhaustion
1.1 The 251% Rally: Price vs Economic Reality
From the COVID low of 7,511 in March 2020 to the peak of 26,373 in September 2025, Nifty50 delivered a 251% return — annualised at 21.3% CAGR over six years. Over the same period, real GDP grew 42% cumulatively and Nifty EPS grew at 8% CAGR. The 13 percentage-point annual gap between price returns and earnings growth was filled entirely by multiple expansion.
Figure 2 · NIFTY Rally (251%) vs Real GDP (42%) — The Divergence
1.2 Yearly RSI 100: The Euphoria Signal
RSI of 100 on the yearly chart — the third such instance in Nifty's history. The 2007 peak (RSI 95+) preceded a −60% correction over four years. The 2019 peak (RSI 90+) preceded a −38% correction. The 2025 reading of 100 is the most extreme of the three. The RSI does not set a timeline — it tells you the price structure has become completely divorced from any mean-reversion anchor.
Figure 3 · NIFTY50 Yearly RSI History (2005–2025) — Three Euphoria Peaks
1.3 Double Top Formation and the Breach
Top 1: 26,373 (September 19, 2025) · Top 2: 26,341 (February 12, 2026 — first lower high, post India-US trade deal) · Valley Low: 24,571 (Budget Day 2025)
The double top was confirmed with the breach of 24,571 on March 4 — the same day we initiated our Sell. Pattern target: 22,800 (= 24,571 − 1,802). Nifty has since made a low of 22,955, effectively meeting the target, before the current corrective bounce.
The double top target of 22,800 has been met. Next levels: 22,300–22,500 (2023–24 consolidation) and 21,743 (November 2024 swing low). The 24,000–24,250 zone acts as supply — prior support is now resistance. Any rally into that range on light volume is re-entry, not reversal. A breach of the previous session's low confirms downtrend resumption.
1.4 Fibonacci Retracement — The Target Architecture
| Fibonacci Level | Price Target | Significance |
|---|---|---|
| 0% (Peak) | 26,373 | September 2025 all-time high |
| 23.6% | 21,920 | Minor support — already tested |
| 38.2% | 19,180 | Base Case — 16.5× PE on ₹1,150 EPS |
| 50.0% | 16,960 | Bear Case — war extends; CAD stress |
| 61.8% | 14,740 | Worst Case — Hormuz closure + MF cascade |
| 78.6% | 11,580 | Extreme deep retracement |
| 100% | 7,511 | COVID low |
Fibonacci levels on the 7,511→26,373 COVID-recovery rally. Current level 23,850 sits well above the 38.2% base case, confirming significant downside remains.
Section 2: Fundamentals — The Earnings Reality
2.1 Earnings Growth: The Deceleration Nobody Priced In
Nifty50 EPS grew from ₹884 (September 2023) to ₹1,131 (September 2025) — 28% over two years, respectable on paper. But FY25 saw earnings estimates cut by 2–3% every single quarter. The 12-month forward EPS has been revised from ₹1,230 to ₹1,185 in just two months, and FY26 growth expectations cut from 18% to 12%. The post-COVID recovery cycle — 20%+ earnings growth from low base, margin expansion, commodity tailwinds — is over.
Our base case target uses trailing EPS of ₹1,150 rather than the ₹1,185 forward consensus — a deliberate choice reflecting the consistent pattern of quarterly estimate cuts in FY25. Applying a fair value PE to inflated forward estimates produces false precision that the last four quarters have repeatedly punished.
2.2 The Multiple Expansion Story
From 2018 to 2026, Nifty50 delivered 135% total returns while index EPS grew approximately 64%. The 71 percentage-point gap was filled by multiple expansion — PE went from 18× in 2018 to 22.3× today. The current 22.3× remains 24–39% above the 16–18× long-term fair value band. The reversal of this expansion is not a prediction — it is what the last 18 months of data already show.
2.3 India GDP Performance
| Year | Real GDP Growth | Nominal GDP Growth (Est.) |
|---|---|---|
| 2018 | 6.5% | ~11.5% |
| 2019 | 3.9% | ~8.0% |
| 2020 | −5.8% | −3.0% |
| 2021 | 9.7% | 14.5% |
| 2022 | 7.0% | 12.0% |
| 2023 | 8.2% | 13.5% |
| 2024 | 7.3% | 11.8% |
| 2025 | 6.5% | 10.5% |
| 2026E | 6.8% | 8.6% |
2.4 GDP Growth vs Nifty Returns: The Decoupling
| Metric | CAGR (2018–2026) |
|---|---|
| Nominal GDP | ~11% |
| Nifty50 EPS | ~8% |
| Nifty50 Total Return | 10.6% |
Nifty50 earnings have lagged nominal GDP by 300 basis points annually for eight consecutive years. If EPS had grown closer to nominal GDP pace, today's earnings base would be approximately ₹1,400–1,500 rather than ₹1,150 — 22–30% higher. All the extra index return came from multiple expansion. That expansion is the risk that is now unwinding.
2.5 Structural Reasons for the Earnings Lag
- Sector misalignment: Nifty50 overweight in balance-sheet-heavy sectors (power, construction, metals, telecom, oil and gas) — 30–35% of GDP but underperformers
- Missing growth engines: High-growth unlisted sectors — e-commerce, ride aggregators, electronics manufacturing — absent from the index
- Capital destruction: 31 of 50 companies delivered returns below cost of capital over ten years
- Earnings concentration: Financials contribute 35–40% of index earnings — dangerous single-sector dependency when the credit cycle turns
Section 3: Market Cap to GDP — The Buffett Indicator
The ratio has spent seven of the last eight years above the 85.7% historical median. It peaked at 144% in August 2024 and stands at 133.6% today — 56% above median, 2.2 standard deviations above mean. Only twice in 30 years has India sustained above 130%: 2007 (followed by a 60% crash) and 2024 (the current correction).
Figure 4 · Market Cap to GDP Ratio (2018–2025) — Buffett Indicator
At the 85.7% median, Nifty fair value works out to approximately 16,500 — consistent with our Worst Case scenario. The 2007 pre-crisis peak was 146.4%; we are 1,200 basis points away from that level today.
Section 4: Valuation — PE, Forward Estimates and the Earnings Mirage
4.1 Current Valuation Metrics
| Metric | At Initiation (24,500) | Fair Value Range | Assessment |
|---|---|---|---|
| Trailing 12M PE | 22.30× | 16–18× | 24–39% overvalued |
| 12M Forward PE | 21.55× | 15–17× | Overvalued on consensus |
| Price to Book | 3.46× | 2.5–3.0× | Elevated |
| Dividend Yield | 1.22% | 1.5–2.0% | Below fair yield |
| Weighted PEG | 2.12× | <1.5× | Pricing perfection |
Metrics at Sell initiation date (March 4, 2026). Current Nifty level: 23,850.
4.2 The Forward Estimates Problem
- FY26 EPS growth: 8% — down from 16% estimated one year ago. Pattern of 2–3% quarterly cuts throughout FY25 repeating.
- FY27 EPS growth: 16% — the same optimism recycled to next year, four years running.
- Q2 FY26: Revenue growth 6.2%, EBITDA growth 12.8% — entire beat from one-time input cost relief, not top-line strength. That tailwind is reversing as crude and LPG costs surge.
- Financials concentration: 35–40% of index earnings from banks. If NPAs rise as the credit cycle turns, one-third of the index disappoints simultaneously.
4.3 Realistic Earnings Scenario
FY26 EPS (trailing): ₹1,150
FY27 EPS at 8% growth: ₹1,242
FY28 EPS at 8% growth: ₹1,341
Fair Value at 18× PE (FY27): ₹1,242 × 18 = ₹22,356
Mean Reversion at 16.5× (FY26): ₹1,150 × 16.5 = ₹18,975
→ Year-end 2026 Base Case Target: 19,000
→ 22.4% downside from initiation (24,500) · ~20% from current (23,850)
Section 5: Constituent-Level Valuation Analysis
PE and PEG figures updated from Screener.in live data (March 18). Where PE has declined from initiation levels, this reflects 14 days of correction — confirming the distribution thesis. PEG ratios use 12-month forward consensus EPS growth estimates (FY26–FY27), not trailing 3-year CAGR. Screener's trailing method produces materially different readings for banks and Airtel where FY21 was a distorted low base — flagged below.
5.1 Top 10 Nifty50 Constituents by Weight
| Stock | Weight | PE (live) | PEG (fwd) | Assessment |
|---|---|---|---|---|
| Reliance Industries | 9.5% | 24.81 | 4.62 | Overvalued |
| HDFC Bank | 8.2% | 17.44 | 0.76* | Fair — trailing PEG deceptive (FY21 low base) |
| SBI | 6.8% | 12.12 | 0.41* | Inexpensive on PE; NPA cycle risk not priced |
| ICICI Bank | 6.2% | 17.53 | 0.66* | Fair by trailing; credit cycle risk rising |
| Bharti Airtel | 5.5% | 34.51 | 0.41* | Overvalued; promoter reduced stake −1.40% |
| TCS | 5.1% | 17.32 | 2.11 | Overvalued; AI disruption underpriced |
| Infosys | 4.8% | 17.86 | 2.77 | Overvalued — PEG worse than headline estimates |
| ITC | 3.5% | 18.53 | 2.03 | Overvalued |
| Kotak Mahindra Bank | 3.2% | 19.80 | 0.89* | PE compressed from 21.85; credit cycle watch |
| Larsen & Toubro | 2.9% | 29.11 | 1.27 | Overvalued; PE compressed from 32.77 |
* Trailing 3yr PEG — low due to depressed FY21/22 earnings base. Forward PEG is materially higher.
5.2 The Extreme Outliers — Nifty's Speculative Fringe
| Stock | CMP (₹) | PE | PEG | EPS (₹) | MCap (₹ Cr) | Note |
|---|---|---|---|---|---|---|
| Eternal (Zomato) | 242.35 | 1,012 | 32.07 | 0.24 | 2,33,876 | PE 1,012× — ₹0.24 EPS at ₹242. One earnings miss collapses the multiple. |
| Jio Financial | 248.55 | 99.76 | N/A | 2.53 | 1,57,907 | No 3yr profit track record. ₹1.58L Cr MCap on pure optionality. |
Strip both from the index PE and the remaining 48-stock number is lower — their presence is the late-cycle symptom this report documents.
5.3 PE Distribution Across Nifty50
| PE Range | Stocks | Weight | Category |
|---|---|---|---|
| <15x | 8 | 22% | Cyclicals / PSUs — cheap but facing headwinds |
| 15–20x | 18 | 48% | Fair value only if ALL deliver consensus growth |
| 20–30x | 14 | 18% | Expensive |
| >30x | 10 | 12% | Severely overvalued |
48% of index weight sits in the 15–20× zone — priced to perfection. Any earnings miss and 'fair value' becomes expensive overnight.
5.4 Sector PEG Analysis
| Sector | Avg PE | Growth Est. | PEG | Assessment |
|---|---|---|---|---|
| Banking | 17.2 | 12% | 1.43 | Fairest sector — NPA cycle risk not yet priced |
| Oil & Gas | 11.5 | 6% | 1.92 | Cheap PE; CAD and crude shock risk |
| IT Services | 22.5 | 8% | 2.81 | Overvalued; AI disruption underpriced |
| Telecom | 36.5 | 18% | 2.03 | Overvalued; promoter selling a red flag |
| Auto | 28.5 | 12% | 2.38 | Overvalued |
| Capital Goods | 42.0 | 15% | 2.80 | Overvalued; order pipeline scrutiny rising |
| Pharma | 34.6 | 13% | 2.66 | Overvalued |
| FMCG | 48.5 | 10% | 4.85* | Severely overvalued (sector avg understated) |
* FMCG sector PEG of 4.85 is a blended average — individual names (HUL 8.6, Nestle 6.9, Tata Consumer 7.84) are materially worse. See Section 5.5.
5.5 FMCG: The Sector Average Conceals Worse Reality
| Stock | PE | PEG (Screener live) | Profit CAGR 3yr | Sales CAGR 3yr |
|---|---|---|---|---|
| Hindustan Unilever | 46.10 | 8.60 | 5.36% | 6.37% |
| Nestle India | 73.13 | 6.92 | 10.57% | 11.08% |
| Tata Consumer | 73.51 | 7.84 | 9.38% | 12.34% |
| Titan Company | 75.57 | 5.16 | 14.64% | 28.04% |
| Trent | 78.31 | 0.57 | 137.07% | 56.18% |
HUL at PEG 8.6x on 5.4% profit CAGR; Nestle at PEG 6.9x on 10.6%. Trent at PEG 0.57 is the one genuine exception.
5.6 IT Sector: The Risk Is Least Priced Where It Is Most Acute
| Stock | PE | PEG | Profit CAGR 3yr | Assessment |
|---|---|---|---|---|
| Tech Mahindra | 28.30 | −2.63 | −10.77% | PE 28× on declining earnings — most overvalued in IT on any metric |
| Wipro | 15.40 | 6.72 | 2.29% | Cheapest PE; PEG 6.72 on 2.3% growth — value trap |
| Infosys | 17.86 | 2.77 | 6.45% | Overvalued on growth-adjusted basis |
| TCS | 17.32 | 2.11 | 8.19% | Structural scale advantage; still PEG 2.11 |
| HCL Technologies | 21.49 | 2.46 | 8.75% | Best quality in cluster; ROA 16.95% |
Tech Mahindra: PE 28× on earnings that have declined 10.77% over three years.
5.7 Promoter Distribution Signals
- Bharti Airtel: −1.40% promoter stake reduction — the largest in the top-10 — at PE 34.5×. Promoter selling at elevated multiples during a distribution phase is a classical warning signal.
- JSW Steel: 11.70% pledged promoter shares — highest pledge ratio in the dataset. Steel sector −43% profit CAGR over three years. Pledged shares represent forced-sale overhang if a margin call triggers during a broader correction.
- Asian Paints: 8.60% pledged — second highest, at PE 53× on 8.4% profit CAGR.
5.8 Weighted Index PEG: 2.12 — Pricing Perfection
Index PEG = Index PE / Consensus EPS Growth = 22.30 / 10.5% = 2.12
Figure 5 · Global PEG Comparison — NIFTY50 vs Peers
Nifty50 trades at a 54% premium to the EM average PEG and an 84% premium to Hong Kong. There is no fundamental justification for this premium given that India's EPS growth has lagged nominal GDP by 300 bps annually for eight consecutive years.
Section 6: Mutual Fund Liquidity Risk
SIP inflows hit ₹3.34 lakh crore in 2025 (+25% YoY). Total MF AUM reached ₹80.23 lakh crore in December 2025. Monthly average ₹27,833 crore; peak month December 2025 ₹31,000 crore. Household equity allocation has risen from 2% to 15% of savings over the decade — late-cycle peak allocation.
SIP Inflows 2023
₹1.84L Cr
Base year
SIP Inflows 2024
₹2.68L Cr
+46% growth
SIP Inflows 2025
₹3.34L Cr
+25% YoY · Peak month ₹31,000 Cr
Total MF AUM
₹80.23L Cr
Dec 2025 — 2.5× larger than Mar 2020
During March 2020's COVID crash, mutual funds across all categories saw combined outflows of approximately ₹1.1 lakh crore in a single month from an AUM base of roughly ₹32 lakh crore. The AUM is now 2.5× larger. If the same redemption-to-AUM ratio holds, outflows of ₹2.5–3.0 lakh crore in a compressed window become the math. DIIs — the market's backstop absorbing FPI selling throughout 2024–25 — would be forced to become net sellers. The market simultaneously loses its marginal buyer and gains a large marginal seller.
The mid and small-cap liquidity stress exceeding 100 days already visible in the data is the early signal of this process. Large-cap stress follows — it just comes last. This creates pro-cyclical liquidity: abundant during rallies, evaporating at precisely the moment buyers are needed most.
Section 7: Global Macro Risks
Figure 6 · Global Macro Risk Assessment — Severity vs Probability
Risk 0 (Most Immediate): West Asia Conflict and Strait of Hormuz
At time of original publication (March 4), the Hormuz disruption was framed as a prospective risk. By March 18, it is the operating environment. India's crude basket is at $142.69 per barrel (PPAC data, March 16) against Brent at $103. That $39–40 spread reflects freight surcharges, war-risk insurance, and intermediary margins that Brent futures do not capture. Our original analysis applied Brent prices to India's import calculations and systematically underestimated the shock.
Iran struck Saudi Aramco's Ras Tanura refinery and Iraq's Rumaila oil field in early March, amplifying the shock beyond pure transit risk. Brent spiked 9.3% in a single session before settling at $103. The India basket moved faster and further.
Brent Futures (Mar 17)
$103
per barrel
India Crude Basket (Mar 16)
$142.69
PPAC — $39 above Brent
Basket–Brent Spread
$39–40
Freight + war-risk premium
CAD Impact: Recalibrated from Five Independent Sources
| Institution | Sensitivity | Projected CAD at $100–105 Brent Sustained |
|---|---|---|
| ICRA | 30–40 bps per $10/bbl | 1.9–2.2% of GDP (from 0.7–0.8% baseline) |
| Morgan Stanley | ~50 bps per $10/bbl | ~3.0% of GDP possible |
| MUFG Research | 0.4–0.5% GDP per $10/bbl | ~3.0% of GDP at $100 |
| SBI Research | 36 bps per $10/bbl | 1.8–2.0% of GDP |
| IDFC First Bank | 0.4% GDP per $10/bbl | ~2.2% of GDP at $100 |
Pre-conflict FY26 Brent baseline: $67–68/bbl
Current Brent (March 17): ~$103/bbl
Rise above FY26 baseline: ~$35/bbl
ICRA: CAD widens to 1.9–2.2% (from 0.7–0.8% pre-conflict)
Additional CAD pressure: 110–175 bps
Every $1/bbl = ~$2B additional annual import bill
$35/bbl shock = ~$70B per year · ~$35–40B for 6-month disruption
Original estimate: "$15–20B" → understated by 3–4×
Russia's Supply Role: Nuance That Matters
- Share declined before the crisis: Kpler data shows Russian crude fell from 43–44% of Indian imports (June–July 2024 peak) to 21.2% by January 2026, driven by US sanctions on Rosneft and Lukoil (November 2025) and 50% tariffs on Indian exports.
- 30-day OFAC waiver (March 6): US Treasury issued a temporary licence for Indian refiners to purchase ~30 million barrels of Russian crude stranded at sea. IOC and Reliance were primary buyers. Waiver expires April 4, 2026 — one-time clearance, not a policy reversal.
- India now imports from 40 countries (up from 27 in 2006–07). Non-Hormuz supply ~70% of imports (Petroleum Minister Puri, March 16). But adaptation is not free — every percentage point shifted to longer routes adds freight cost and war-risk premiums, precisely what inflates the basket to $143.
LPG and LNG: India's More Acute Exposure
| Commodity | Hormuz Dependency | Current Stress (March 2026) |
|---|---|---|
| LPG | 80–90% of imports via Hormuz | Cylinder prices up ₹60 in metros; commercial up ₹114–115. Essential Commodities Act invoked. 25-day inter-booking restriction. No viable non-Gulf alternative at scale. |
| LNG / Natural Gas | 53%+ from Qatar and UAE; 60% Gulf-linked | Asian spot gas at $19–20/MMBtu vs $10–11 in February 2026. Natural Gas Control Order issued March 9. Industrial allocations cut. |
| Fertilisers | ~40% of imports from Middle East | Gas feedstock disruption. Risk of repeating FY22 fertiliser subsidy overrun of 0.6% of GDP if unresolved through Kharif season. |
MUFG Research (March 12): "This time is different — not just higher oil prices but a potential looming energy shortage, with India and Asia disproportionately hit."
- Inflation: $143 crude basket → CPI heading to 6.0–6.5%. RBI rate cut cycle delayed or reversed. Margin compression across consumer and industrial sectors simultaneously.
- War extends beyond March: Bear Case 17,000 shifts from tail to elevated probability. Dual compression — PE de-rating plus EPS cuts — simultaneously.
- Hormuz closure (worst case): Global recession trigger. Nifty worst-case target 15,000 becomes realistic. MF redemption cascade amplifies the move.
- Historical precedent: 2019 Aramco attacks caused a 15% oil spike and 8% Nifty correction in three weeks. The current disruption is structurally more severe — multiple energy vectors, no clear resolution timeline, arriving when domestic valuations are far more stretched than in 2019.
Risk 1: AI Bubble and GPU Depreciation Crisis
Tech giants are extending GPU useful life from 3 years to 6+ years for depreciation accounting, artificially inflating reported earnings. Nvidia releases new chip generations every 18–24 months — rendering previous generations economically obsolete long before the accounting life expires. Hidden depreciation time bomb estimated at $176 billion (2026–2028, per Michael Burry). India's IT sector (13% of Nifty50) faces double impact: revenue pressure from AI agents reducing enterprise software demand, and margin compression from mandatory AI investment requirements.
Risk 2: Private Credit Market Implosion
The $3 trillion US private credit market has 20–25% exposure to PE-owned SaaS companies now disrupted by AI. Approximately 1,900 PE-backed software firms financed with private credit since 2015 face revenue stagnation. Covenant-lite structures mask stress until actual defaults arrive. Default rates forecast at 13% versus 4% for public high-yield bonds. $46.9 billion already trading at distressed levels. Transmission to India: global risk-off triggers FPI outflows; credit spreads widen, raising funding costs for Indian corporates already under earnings pressure.
Risk 3: Yen Carry Trade Unwind
Estimated $500B+ directly tied to yen carry positions. BoJ rate hikes to 0.75% (February 2026) with normalisation to 1.5–2.0% by 2027 likely. Historical carry unwinds have caused cascading EM selloffs. August 2025 — when BoJ raised rates to just 0.25% — caused a 10%+ single-day crash in Japanese equities. The next unwind, if BoJ reaches 1.5–2.0%, would be structurally larger.
Risk 4: US Housing Market Stress
Home prices flat to slightly down for 2026. Mortgage rates stuck above 6%. Affordability at cycle highs. Regional divergence: West Coast and Sun Belt seeing inventory glut and price declines. Commercial real estate distress bleeding into regional bank balance sheets. Wealth effect reversal reduces US consumption → Indian IT services and export revenues decline.
Risk 5: De-dollarization Transition
BRICS nations advancing gold-backed currency initiative. Central bank gold purchases at record levels. Trade settlement in local currencies accelerating. While structurally positive for India long-term, the transition period is disruptive — dollar scarcity episodes, EM currency pressure, and FPI flow constraints are near-term risks that markets are underpricing.
Risk to Target (Upside Scenarios)
Targets could prove conservative if:
- West Asia resolution: The single most powerful upside catalyst — ceasefire or Hormuz reopening normalises crude to $75–80, reverses CAD stress, allows RBI rate cuts.
- Policy intervention: RBI rate cuts front-loaded with fiscal stimulus; government spending accelerated into H2 FY26.
- Global risk-on: Fed aggressive dovish pivot; AI bubble fears dissipate.
- Earnings surprise: Domestic consumption recovers faster than expected; banking NPAs stay benign.
- Technical support: 22,000–22,500 proves strong accumulation zone; DII buying accelerates.
Risk-reward remains decisively asymmetric to the downside. Upside to 26,500 requires a perfect macro environment across every variable simultaneously — very low probability. Downside to 16,500–17,000 requires only that one or two documented risks persist with any duration — meaningfully higher probability. War extension beyond March tilts the Bear Case (17,000) from tail to base case. That is not a symmetric bet.
Conclusion and Key Takeaways
This is not a prediction of financial apocalypse. It is a mean reversion argument in an index that has expanded its multiple by 13 percentage points in six years while its constituents have grown earnings at 8% annually. The math closes eventually — it always does.
Sell view · Recorded low
24,500 · 22,955
Initiated March 4
PE · MCap/GDP · PEG
22.3 · 133.6% · 2.12
All in overvalued territory
Earnings gap
−300 bps
EPS CAGR vs Nominal GDP — 8 years
MF AUM at risk
₹80L Cr
Retail SIP dependent — procyclical
- Trade update: Sell view initiated at 24,500 on March 4. Nifty low recorded since initiation: 22,955. Current bounce to 23,850 does not alter the trend. The 24,000–24,250 zone is supply. Breach of previous day's low confirms resumption.
- Valuation: PE 22.30×, Market Cap/GDP 133.6%, Weighted PEG 2.12 — all in overvalued territory.
- Fundamentals: EPS CAGR 8% lags nominal GDP 11% by 300 bps annually — eight years running. Forward estimates face the same quarterly cut cycle as FY25.
- Liquidity: ₹80 lakh crore MF AUM built on retail SIP flows is procyclical. Redemption pressure accelerates once losses exceed retail pain thresholds.
- West Asia: India's crude basket at $142.69 (not Brent at $103). CAD impact is 110–175 bps, not 40–50 bps. LPG and LNG exposure are underappreciated second-order shocks. War extension beyond March raises Bear Case probability materially.
- Sector risk: Tech Mahindra PE 28× on −10.77% profit CAGR; HUL PEG 8.6x and Nestle PEG 6.9x — sector averages masked severity; small-cap liquidity crisis already underway.
Year-end 2026 Base Case Target: 19,000
Fair value PE 16.5× × Trailing EPS ₹1,150 = 18,975 ≈ 19,000
22.4% downside from initiation (24,500) · ~20% from current (23,850)
Bear Case: 17,000 · Worst Case: 15,000
Bear Case probability rises materially if West Asia extends beyond March.
Disclaimer
Investment in the market is subject to market risk, read all documents carefully before investing. Our clients or we may have short positions in the Nifty or mentioned stocks in the report.
Tradzo Research is a Registered Partnership firm, a SEBI Registered Research Analyst (INH000024675) under SEBI RA Regulation 2014.
Registered Office: A-416 Sumel 11, Namaste Circle, Shahibaug, Ahmedabad – 380004.
Telephone: +91 7990433195 · Website: www.tradzo.in
Member ID Research Analyst: Harsh Patel · Email: harsh@tradzo.in
Data Sources: Screener.in (live, 18 March 2026) · PPAC (ppac.gov.in)
Please read the SEBI prescribed Combined Risk Disclosure Document prior to investing. Read full disclosure
